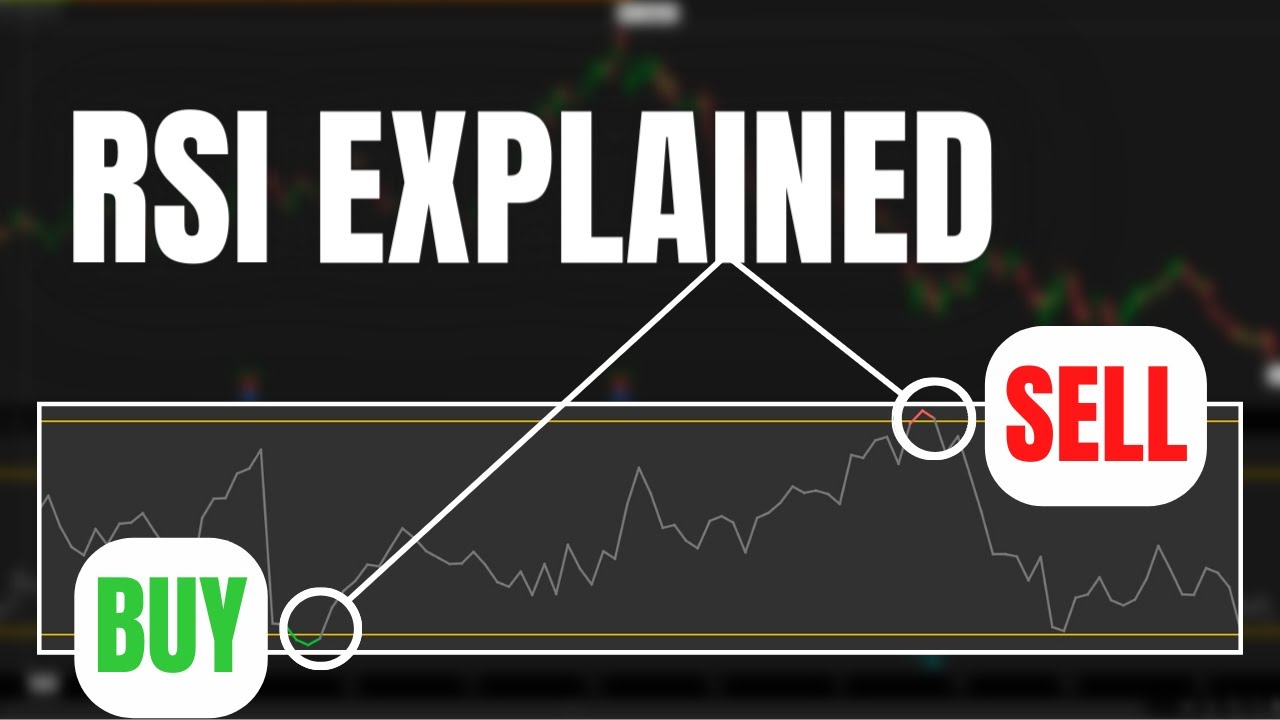
RSI Indicator Explained (Relative Strength Index)
15K views · Dec 17, 2022 shortthestrike.com
The Relative Strength Index (RSI) is an incredibly popular technical indicator that uses recent price action to evaluate oversold or overbought conditions in the price of a stock. Throughout this video we’ll go over how the indicator is calculated, how it can used in practical applications, and how to create custom scans to find those stocks that indicate bullish or bearish reversal. Like most indicators, RSI is not perfect. The indicator cannot factor in events like earnings or economic news that could impact the value of the stock. It’s important you do not use this as you’re sole signal for a trade, but rather use it in conjunction with other indicators and outside context to make your decisions. Timestamps 0:00 Intro 0:30 RSI Calculation 2:05 Adding RSI to Charts 4:20 Practical Examples 9:08 RSI Custom Scans 15:23 Outro ➤ Open a tastyworks account: https://start.tastyworks.com/#/login?referralCode=PKSKCFVD2J ➤ Start Investing with M1 Finance: https://m1finance.8bxp97.net/151KXm Disclaimer: Some of these links go to one of my websites and some are affiliate links where I'll earn a small commission if you make a purchase at no additional cost to you.
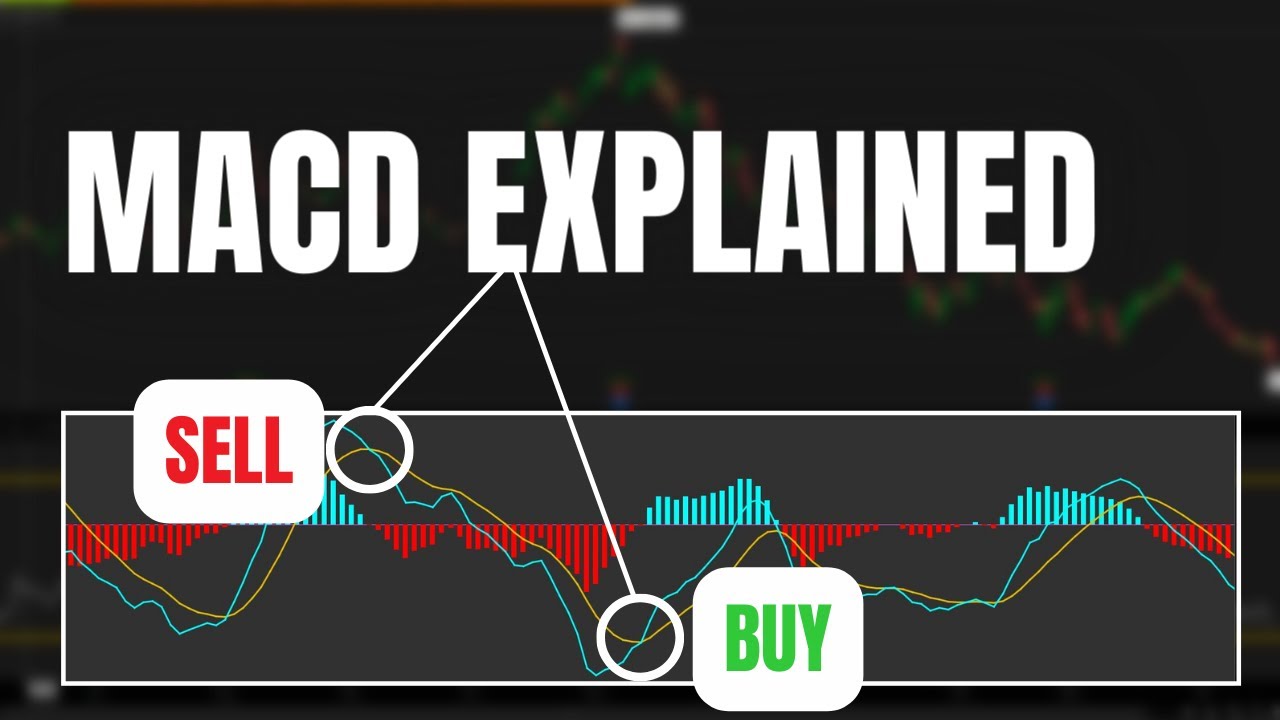
MACD Indicator Explained (Moving Average Convergence Diverge...
19K views · Dec 16, 2022 shortthestrike.com
The MACD is a popular momentum indicator that traders use to find potential buy or sell signals in the underlying stock. Throughout this video we’ll go over how the indicator is calculated, how it in can be used in practical application and how to create custom scans to find those stocks that meet our criteria. There are several different methods traders use to find potential buy or sell opportunities. This includes both the MACD crossover and MACD divergence. Timestamps 0:00 Intro 0:25 MACD Calculation 1:44 Adding MACD to Charts 3:57 Practical Examples 7:47 MACD Custom Scans 15:00 Outro ➤ Open a tastyworks account: https://start.tastyworks.com/#/login?referralCode=PKSKCFVD2J ➤ Start Investing with M1 Finance: https://m1finance.8bxp97.net/151KXm Disclaimer: Some of these links go to one of my websites and some are affiliate links where I'll earn a small commission if you make a purchase at no additional cost to you.
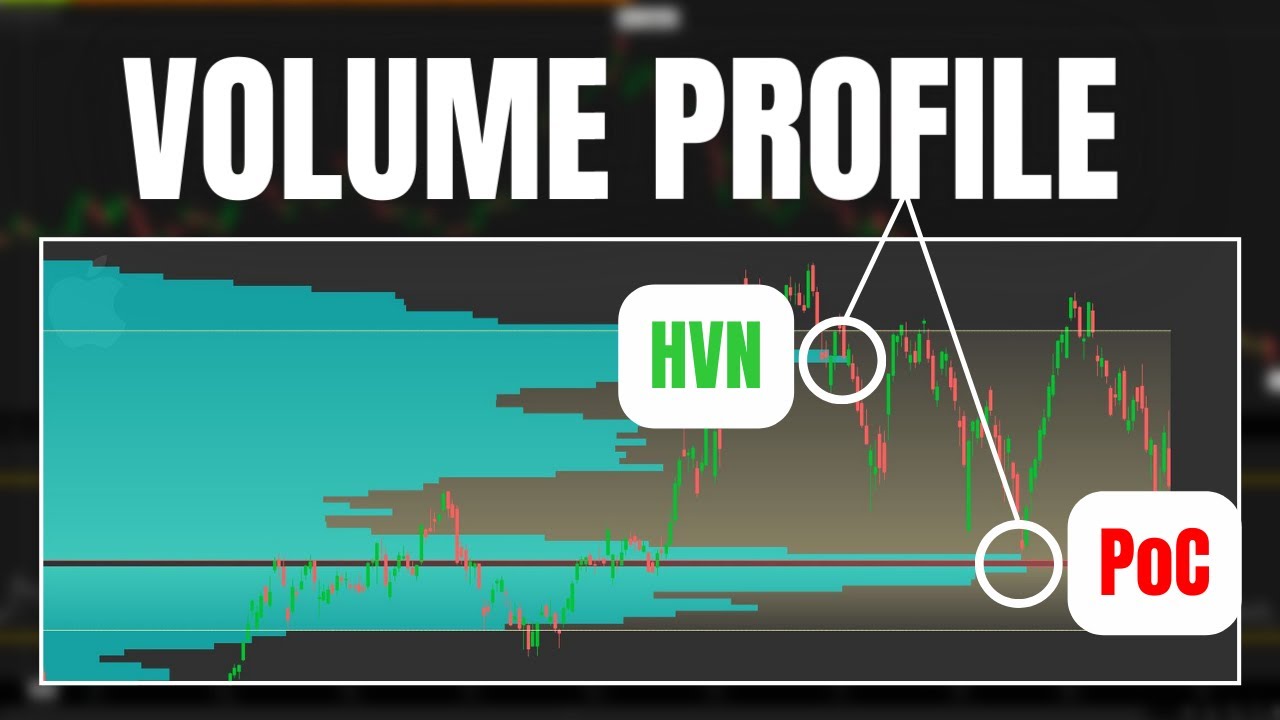
Volume Profile Trading Indicator | How to Trade Using Volume...
14K views · Dec 16, 2022 shortthestrike.com
The Volume Profile Indicator allows you to view where a stock has traded over a certain time period. This indicator may be used to find levels of support and resistance or to find unbalanced markets that may indicate a bullish or bearish trend. Throughout this video we’ll discuss how the Volume Profile is calculated, how it can be used to find areas of support and resistance, and how it can assist in the confirmation of bullish or bearish trends. We’ll cover the ins and outs of the volume profile indicator to ensure you understand exactly what you’re looking at. Timestamps 0:00 Intro 0:25 Charting Volume Profile 1:48 Volume Profile Calculation 3:28 Volume Profile Example 6:57 Outro ➤ Open a tastyworks account: https://start.tastyworks.com/#/login?referralCode=PKSKCFVD2J ➤ Start Investing with M1 Finance: https://m1finance.8bxp97.net/151KXm Disclaimer: Some of these links go to one of my websites and some are affiliate links where I'll earn a small commission if you make a purchase at no additional cost to you.
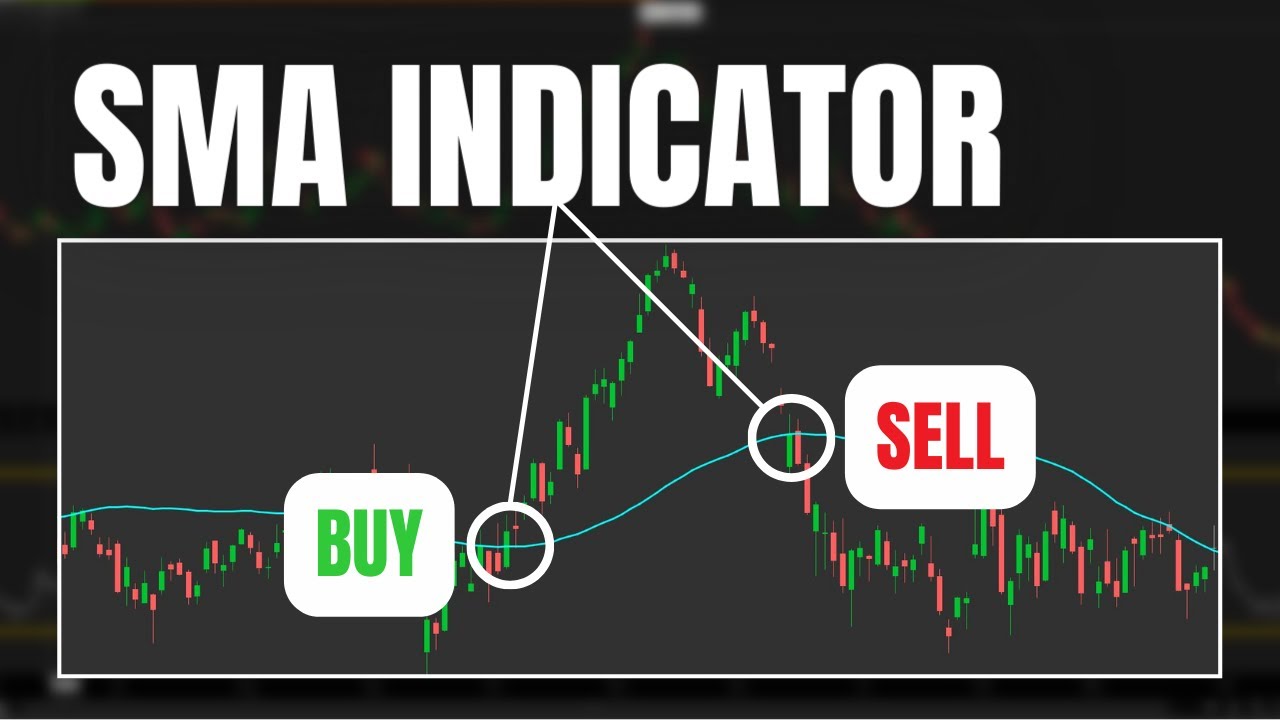
Simple Moving Average (SMA) Trading Indicator | How to Trade...
5K views · Dec 16, 2022 shortthestrike.com
The Simple Moving Average, or SMA, is a popular technical indicator that can be used to find potential trend reversals. Throughout this video we’ll go over how the Simple Moving Average (SMA) is calculated, how it in can be used to find buy and sell signals, and how to create custom scans to find those stocks that meet our criteria. There are several different methods traders use to find potential buy or sell opportunities. This includes both SMA price crossovers and moving average crossovers. The most popular of the two crossovers being the death cross or the golden cross. The death cross is seen when the 50 day simple moving average crosses below the 200 day simple moving average. The golden cross being when the 50 day simple moving average crosses above the 200 day simple moving average. Like all indicators, the Simple Moving Average (SMA) lines are not perfect. However, they may give be able to give you some insight as to the overall trend in stock and be made aware of potential trend reversals.
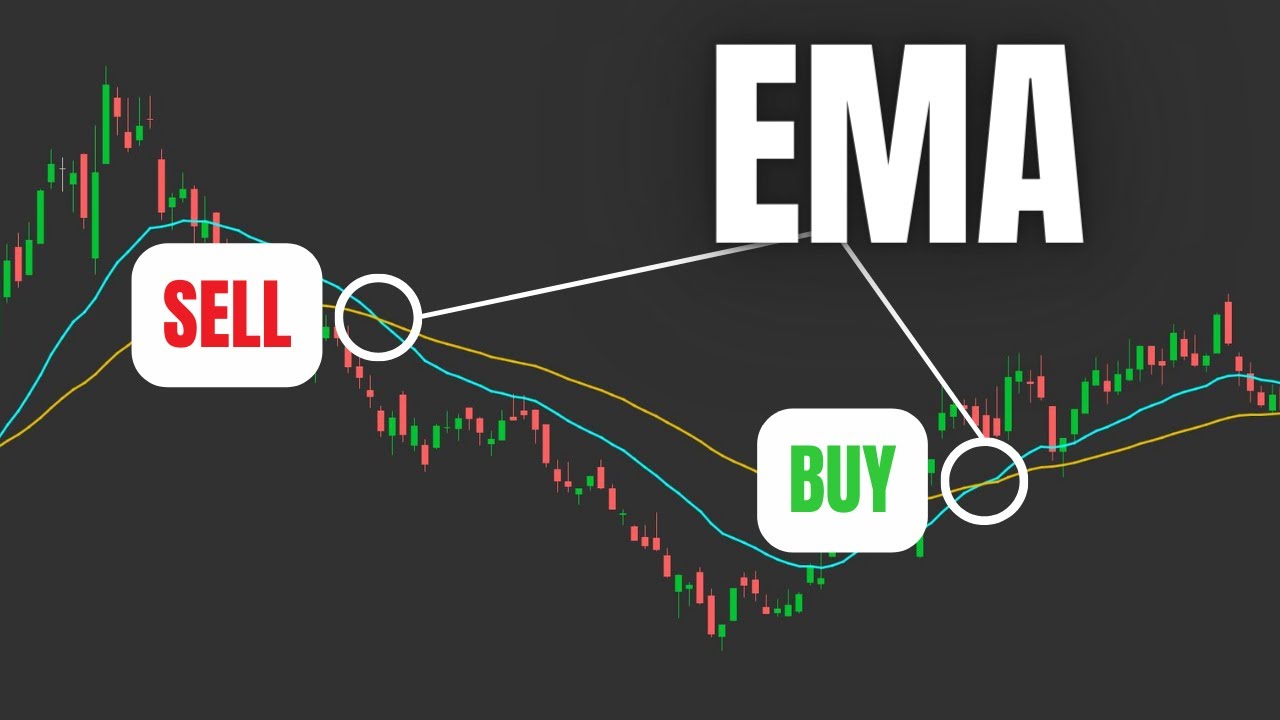
Exponential Moving Average (EMA) Trading Indicator | How to ...
20K views · Dec 16, 2022 shortthestrike.com
The Exponential Moving Average, or EMA, is a popular technical indicators that can be used to find potential trend reversals. Throughout this video we’ll go over how the EMA indicator is calculated, how it in can be used buy and sell signals, and how to create custom scans to find those stocks that have had a recent EMA crossover. There are several different methods traders use to find potential buy or sell opportunities. This includes price crossovers or moving average crossovers. The most popular of the two crossovers the 50 day vs 200 day EMA crossover. However, depending on your trading time frame, you may prefer to use the 20 vs 50 or 12 vs 26. Like all indicators, the Exponential Moving Average (EMA) lines are not perfect. However, they may give be able to give you some insight as to the overall trend in the stock and be made aware of potential trend reversals. Timestamps 0:00 Intro 0:35 EMA Calculation 1:47 Adding EMA to Charts 3:10 EMA Price Crossover 4:46 Moving Average Crossover 6:52 Scan for Crossover 10:58 Outro ➤ Open a tastyworks account: https://start.tastyworks.com/#/login?referralCode=PKSKCFVD2J ➤ Start Investing with M1 Finance: https://m1finance.8bxp97.net/151KXm Disclaimer: Some of these links go to one of my websites and some are affiliate links where I'll earn a small commission if you make a purchase at no additional cost to you.