
Simple Moving Average (SMA) Trading Indicator | How to Trade Simple Moving Average Crossovers

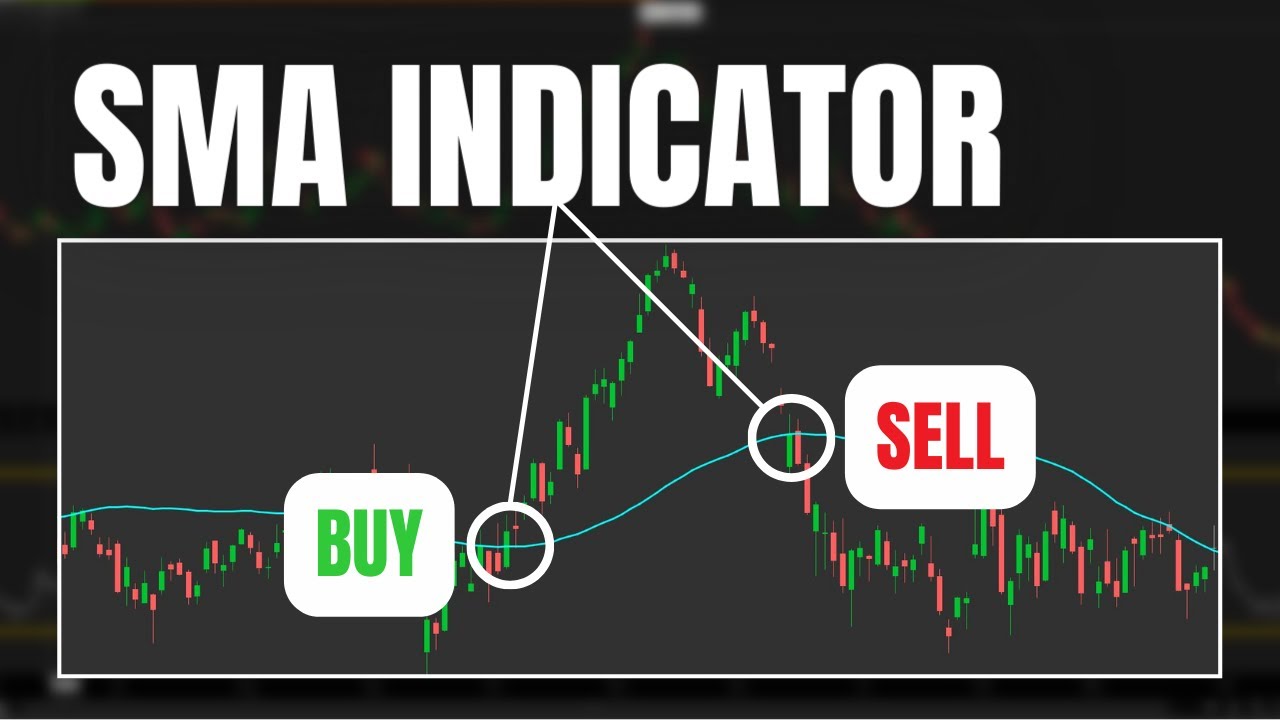
The Simple Moving Average, or SMA, is a popular technical indicator that can be used to find potential trend reversals. Throughout this video we’ll go over how the Simple Moving Average (SMA) is calculated, how it in can be used to find buy and sell signals, and how to create custom scans to find those stocks that meet our criteria. There are several different methods traders use to find potential buy or sell opportunities. This includes both SMA price crossovers and moving average crossovers. The most popular of the two crossovers being the death cross or the golden cross. The death cross is seen when the 50 day simple moving average crosses below the 200 day simple moving average. The golden cross being when the 50 day simple moving average crosses above the 200 day simple moving average. Like all indicators, the Simple Moving Average (SMA) lines are not perfect. However, they may give be able to give you some insight as to the overall trend in stock and be made aware of potential trend reversals.