
MACD Indicator Explained (Moving Average Convergence Divergence)

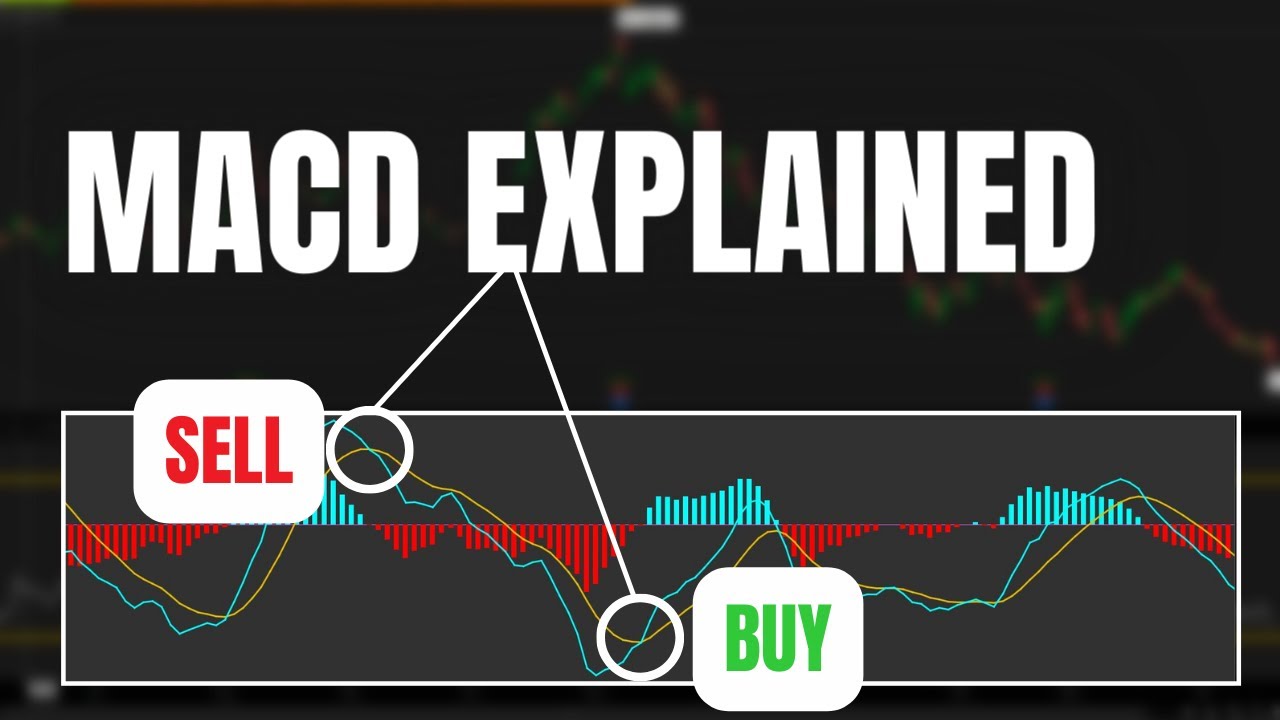
The MACD is a popular momentum indicator that traders use to find potential buy or sell signals in the underlying stock. Throughout this video we’ll go over how the indicator is calculated, how it in can be used in practical application and how to create custom scans to find those stocks that meet our criteria. There are several different methods traders use to find potential buy or sell opportunities. This includes both the MACD crossover and MACD divergence. Timestamps 0:00 Intro 0:25 MACD Calculation 1:44 Adding MACD to Charts 3:57 Practical Examples 7:47 MACD Custom Scans 15:00 Outro ➤ Open a tastyworks account: https://start.tastyworks.com/#/login?referralCode=PKSKCFVD2J ➤ Start Investing with M1 Finance: https://m1finance.8bxp97.net/151KXm Disclaimer: Some of these links go to one of my websites and some are affiliate links where I'll earn a small commission if you make a purchase at no additional cost to you.