Up next in 10 CANCEL
PLAY NOW
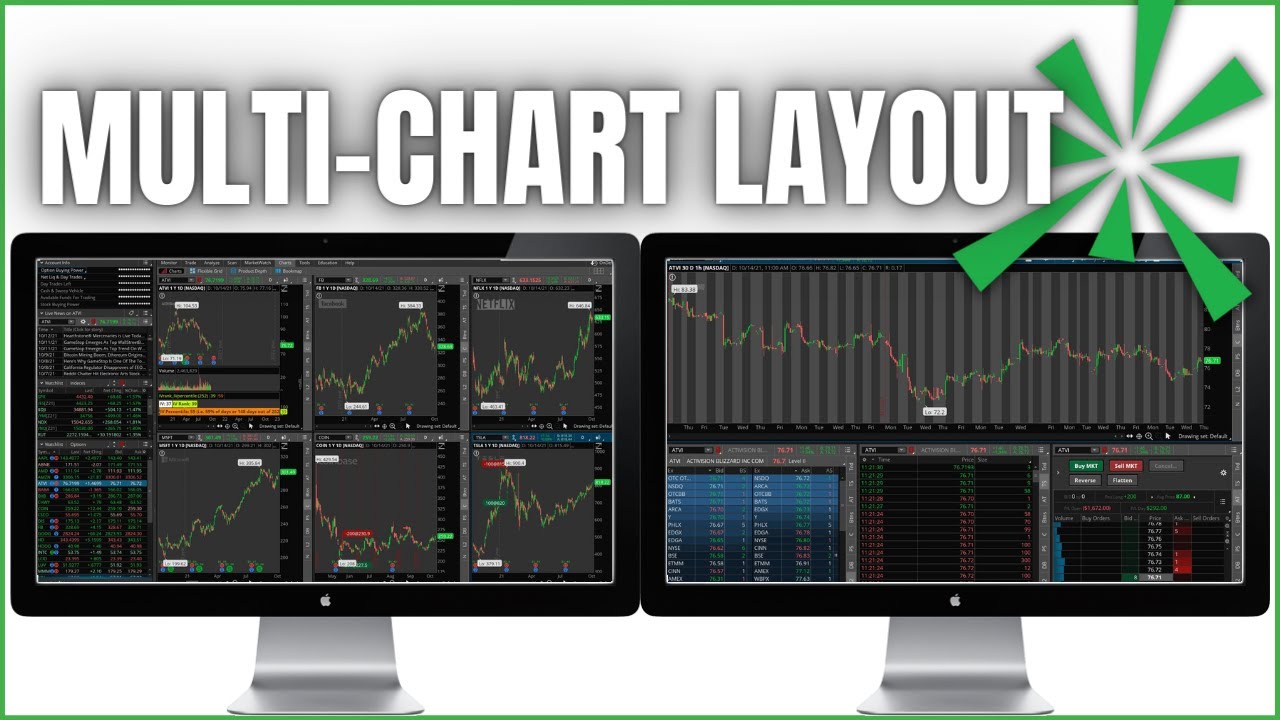
How to Setup Multiple Charts on ThinkorSwim In today’s video we’ll be covering how to view multiple charts within thinkorswim, create multiple different chart templates and how to detach the charts to view them on multiple different monitors.
Timestamps
0:00 Intro
0:36 Creating Multiple Charts
4:20 Adding Charts to Flexible Grid
6:20 Saving Chart Templates
8:24 Detaching Charts for Multiple Monitors
Throughout this video we delve into adding and customizing multiple different chart layouts on both the charts tab and flexible grid tab. The process is very similar between the two, but there are some slight differences. It’s important to keep in mind that they both allow you to view stock charts, level II data, time & sales, new, and much, much more. However, the flexible grid gives you more control with the sizing and location for these additional charts/gadgets. Whereas the charts tab is much more symmetrical.
You’ll also learn how to save your chart layouts and quickly access them in the future. Once you start using this platform actively, you’ll very likely have multiple different chart types, study sets, and layouts you’ll want to be able to flip between quickly. We’ll also cover how to detach the charts and grids and move them to your other monitors.
➤ Start Investing with M1 Finance: https://m1finance.8bxp97.net/151KXm
How I Make My Videos:
Camera: https://amzn.to/3BjqYJY
Show More Show Less #Finance
# Investing
# Stocks & Bonds
Recommended Videos
5 Types of Trades in ThinkorSwim
https://shortthestrike.com/humix/video/792da3719502557330fc0fcf35ed3383b894fda1c6a904f06f4899ab0617b62b
shortthestrike.com
8:23
https://streaming.humix.com/resized-posters/792da3719502557330fc0fcf35ed3383b894fda1c6a904f06f4899ab0617b62b/res640.webp
play_arrow
8:23
play_arrow
23:24
play_arrow
12:35
play_arrow
29:22
play_arrow
31:03
play_arrow
11:14
play_arrow
34:20
play_arrow
29:54
play_arrow
14:38
play_arrow
13:15
play_arrow
2:16
play_arrow
0:45
1
18:49
Trading Futures Options on ThinkorSwim
3K views
·
Dec 19, 2022
2
6:56
21 FREE Fundamentals You Need For ThinkorSwim | Custom Thinkscript for ThinkorSwim
4K views
·
Dec 19, 2022
3
12:25
Buy and Sell Options Using Stock Price on ThinkorSwim Mobile App
117 views
·
Dec 19, 2022
4
16:48
ThinkorSwim Web Options Trading Tutorial
3K views
·
Dec 19, 2022
5
14:45
ThinkorSwim Web OCO Bracket Order Tutorial (Step-by-Step Tutorial)
3K views
·
Dec 19, 2022
6
13:12
How To Add Studies and Customize Charts | ThinkorSwim
4K views
·
Dec 17, 2022
7
11:03
How To Scan for Stocks | Stock Hacker | ThinkorSwim
4K views
·
Dec 17, 2022
8
7:37
How To Buy & Sell Stock | ThinkorSwim
6K views
·
Dec 17, 2022
9
12:46
How to Trade Options on ThinkorSwim (Step by Step) | Beginner Tutorial
3K views
·
Dec 17, 2022
10
11:20
Active Trader Tutorial for Beginners | ThinkorSwim (Best tool for day trading and scalping)
11K views
·
Dec 17, 2022
11
4:03
How To Group Symbols |ThinkorSwim
759 views
·
Dec 17, 2022
12
10:19
How To Create Advanced Orders | OCO Bracket | ThinkorSwim
635 views
·
Dec 17, 2022
13
8:00
How to Create Alerts | ThinkorSwim | Basic alerts and study alerts
7K views
·
Dec 17, 2022
14
11:14
How to Analyze Trades on ThinkorSwim I Risk/Profile for Beginners (Step-by-Step tutorial)
9K views
·
Dec 17, 2022
15
5:32
How to Create Trailing Stops on ThinkorSwim I Step-by-Step Tutorial
1K views
·
Dec 17, 2022
16
9:19
How to Use Earnings Tab on ThinkorSwim I Using Volatility to Trade Earnings
4K views
·
Dec 17, 2022
17
4:16
How to Create Portfolio Alerts in ThinkorSwim | Simple Step-by-Step Tutorial
8K views
·
Dec 17, 2022
18
32:10
ThinkorSwim Tutorial for Beginners 2022 |Step-by-Step Guide to Get Started Trading on ThinkorSwim
3K views
·
Dec 17, 2022
19
20:09
ThinkorSwim Mobile App Tutorial for Beginners 2023 |Step-by-Step Guide to Trade on TOS Mobile
5K views
·
Dec 17, 2022
20
14:01
How to Place Conditional Orders on ThinkorSwim |Automate your Trading
4K views
·
Dec 17, 2022
21
3:22
Account Info on ThinkorSwim Explained | Buying Power, Cash, & Margin Explained
2K views
·
Dec 17, 2022
22
8:31
Account Statement on ThinkorSwim | Step-by-Step 2023
26K views
·
Dec 17, 2022
23
11:59
How to Create a Dynamic Watchlist in ThinkorSwim
2K views
·
Dec 17, 2022
24
12:14
How to Create a Bracket Orders on Options in ThinkorSwim |Advanced Options Orders
9K views
·
Dec 17, 2022
25
7:10
How to Trade After Hours on ThinkorSwim
6K views
·
Dec 17, 2022
26
14:38
Trade Options Fast Using Active Trader on ThinkorSwim
8K views
·
Dec 17, 2022
27
9:38
How to Create a Stop on ThinkorSwim
4K views
·
Dec 17, 2022
28
3:17
Fix Delayed Data and Level II Quotes on ThinkorSwim | Get Realtime Quotes
4K views
·
Dec 17, 2022
29
9:03
How to Place a Stop Loss in ThinkorSwim Mobile App
2K views
·
Dec 17, 2022
30
9:51
How to Roll Options on ThinkorSwim | Step-by-Step Tutorial
561 views
·
Dec 17, 2022
31
28:30
Drawing Tools for Beginners in ThinkorSwim
9K views
·
Dec 17, 2022
32
21:34
ThinkorSwim Web Tutorial for Beginners | TOS Web
3K views
·
Dec 17, 2022
33
24:39
Scanning for High Volatility Stocks | ThinkorSwim Stock Hacker
3K views
·
Dec 17, 2022
34
12:28
Scan for Unusual Options Activity in ThinkorSwim
940 views
·
Dec 17, 2022
35
8:32
OnDemand for Beginners | ThinkorSwim Tutorial
3K views
·
Dec 17, 2022
36
9:43
Thinkback Backtesting Explained | ThinkorSwim
4K views
·
Dec 17, 2022
37
12:52
Cash Secured Put Scan in Thinkorswim
4K views
·
Dec 17, 2022
10:53
How to Setup Multiple Charts on ThinkorSwim
2K views
·
Dec 17, 2022
39
8:49
How to Create OCO Bracket Orders on the ThinkorSwim Mobile App
1K views
·
Dec 17, 2022
40
11:05
How to Create Study Alerts in ThinkorSwim
2K views
·
Dec 17, 2022
41
20:47
How to Setup Futures Trader on ThinkorSwim
3K views
·
Dec 17, 2022
42
11:16
How to Trade Spreads on ThinkorSwim Mobile App
3K views
·
Dec 17, 2022
43
15:12
How to Trade and Understand Iron Condors on ThinkorSwim
2K views
·
Dec 17, 2022
44
11:41
Placing Options Stop Loss Based on Stock Price on ThinkorSwim
2K views
·
Dec 17, 2022
45
8:10
How to Set Trailing Stop Loss on ThinkorSwim Mobile App
89 views
·
Dec 17, 2022
46
8:30
How to Short Stock in ThinkorSwim
2K views
·
Dec 17, 2022
47
7:14
How to Create and Customize a Watchlist on ThinkorSwim
2K views
·
Dec 17, 2022
48
17:54
Stock Market Order Types Explained | ThinkorSwim Tutorial
2K views
·
Dec 17, 2022
49
9:20
Customizing Gadgets in Left Sidebar on ThinkorSwim
10K views
·
Dec 17, 2022
50
19:21
How to Trade and Understand Short Vertical Spreads on ThinkorSwim
3K views
·
Dec 17, 2022
51
5:39
How to Create Alerts on the ThinkorSwim Mobile App | TOS Mobile Tutorial
200 views
·
Dec 17, 2022
52
17:40
How to Add Studies and Drawing on ThinkorSwim Mobile
678 views
·
Dec 17, 2022
53
8:36
Custom Buy and Sell Side Volume Indicator for ThinkorSwim | Custom Thinkscript
4K views
·
Dec 17, 2022
54
4:28
How to Chart Options on ThinkorSwim
4K views
·
Dec 17, 2022
55
5:36
Custom Script for IV Rank and IV Percentile on ThinkorSwim
3K views
·
Dec 17, 2022
56
16:03
Trading Options Using Stock Price on ThinkorSwim Mobile App
6 views
·
Dec 17, 2022
57
5:08
How to Exercise Options on ThinkorSwim
2K views
·
Dec 17, 2022
58
13:46
How to Create a Dividend Scanner in ThinkorSwim
5K views
·
Dec 17, 2022
59
8:04
Premarket Movers Scanner for ThinkorSwim
2K views
·
Dec 17, 2022
60
13:42
How to Trade and Understand Butterfly Spreads on ThinkorSwim
6K views
·
Dec 17, 2022
61
13:39
Options Scanner on ThinkorSwim | Option Hacker Tutorial
1K views
·
Dec 17, 2022
62
8:20
How to Customize Platform Appearance on ThinkorSwim | Color Scheme and Font Size
11K views
·
Dec 17, 2022
63
4:13
How to Set Order Defaults in ThinkorSwim
2K views
·
Dec 17, 2022
64
5:25
Relative Volume RVOL Custom Script for ThinkorSwim
5K views
·
Dec 16, 2022
65
13:45
How to Set Multiple Profit Targets in ThinkorSwim | OCO Bracket Orders
2K views
·
Dec 16, 2022
66
8:03
How to Import a Study or Script into ThinkorSwim
2K views
·
Dec 16, 2022
67
13:16
Best Custom Study Scripts for ThinkorSwim
6K views
·
Dec 16, 2022
68
10:25
How to Set Up Hot Keys on ThinkorSwim
6K views
·
Dec 16, 2022
69
34:20
ThinkorSwim Tutorial for ABSOLUTE Beginners 2022
4K views
·
Dec 16, 2022
70
22:20
Active Trader on ThinkorSwim | Fastest Way to Trade In ThinkorSwim
9K views
·
Dec 16, 2022
71
6:33
Track Positions and Cost Basis in Charts | Custom Script for ThinkorSwim
3K views
·
Dec 16, 2022
72
8:00
Rolling Options in ThinkorSwim | Step-by-Step Tutorial 2022
2K views
·
Dec 16, 2022
73
6:44
Scan for Spreads Using ThinkorSwim Spread Hacker
4K views
·
Dec 16, 2022
74
33:51
ThinkorSwim Mobile App Tutorial for ABSOLUTE Beginners 2022
815 views
·
Dec 16, 2022
75
13:09
Fastest Ways to Trade Options in ThinkorSwim (Day Trading Layout)
5K views
·
Dec 16, 2022
76
9:59
How to Place Stop Loss Orders on ThinkorSwim Desktop
2K views
·
Dec 16, 2022
77
8:58
Better Organize your Activity & Positions Tab on ThinkorSwim
5K views
·
Dec 16, 2022
78
17:07
How to Place Stops on Options in ThinkorSwim (Stop, Trailing Stop, Stock Price, Study Crossover)
903 views
·
Dec 16, 2022
79
10:43
How to Place Stop Loss Orders on ThinkorSwim Mobile App
94 views
·
Dec 16, 2022
80
9:32
How to Short Stock on ThinkorSwim Mobile App
33 views
·
Dec 16, 2022
81
8:26
Paper Trading on ThinkorSwim | PaperMoney Simulated Trading Setup
7K views
·
Dec 16, 2022
82
15:14
Futures Trading on ThinkorSwim Mobile App
362 views
·
Dec 16, 2022
83
22:48
Trading Futures on ThinkorSwim | Process & Setup
4K views
·
Dec 16, 2022
84
10:08
OCO Bracket Orders on ThinkorSwim Mobile App | Take Profit Stop Loss Order
26 views
·
Dec 16, 2022
85
11:55
Buy & Sell Alerts within ThinkorSwim | Indicator Alerts
23K views
·
Dec 16, 2022
86
16:14
Trading Options on ThinkorSwim for Beginners (Step-by-Step Tutorial)
9K views
·
Dec 16, 2022
87
12:19
Buy & Sell Alert Using SMA Cross Over on ThinkorSwim | Death Cross & Golden Cross Alert
3K views
·
Dec 16, 2022
88
12:22
What is Level 2 Data on ThinkorSwim | Time & Sales and Level 2
6K views
·
Dec 16, 2022
89
7:26
Stock Percent Change Script for ThinkorSwim
4K views
·
Dec 16, 2022
90
15:26
Manage Your Risk on ThinkorSwim | Risk Profile Page for Beginners
8K views
·
Dec 16, 2022
91
15:26
Manage Your Risk on ThinkorSwim | Risk Profile Page for Beginners
6K views
·
Dec 16, 2022
92
17:15
Short Selling Stock in ThinkorSwim | Step-by-Step Full Tutorial
2K views
·
Dec 16, 2022
93
13:59
Buy & Sell Alert Using DMI Cross Over on ThinkorSwim
4K views
·
Dec 16, 2022
94
18:18
Manage Portfolio Risk on ThinkorSwim | Risk Profile & Beta Weighting
4K views
·
Dec 16, 2022
95
17:15
Short Selling Stock in ThinkorSwim | Step-by-Step Full Tutorial
2K views
·
Dec 16, 2022
96
13:59
Buy & Sell Alert Using DMI Cross Over on ThinkorSwim
5K views
·
Dec 16, 2022
97
18:18
Manage Portfolio Risk on ThinkorSwim | Risk Profile & Beta Weighting
3K views
·
Dec 16, 2022
98
8:30
3 FREE Options Scripts for ThinkorSwim | Quickly See Unusual Option Activity and Biggest Movers
1K views
·
Dec 16, 2022
99
7:31
Paper Trading on ThinkorSwim Mobile App | ThinkorSwim PaperMoney
125 views
·
Dec 16, 2022
100
11:14
Placing Options Orders Using Stock Price in ThinkorSwim
3K views
·
Dec 16, 2022
101
11:22
Automated Trading on ThinkorSwim | Conditional Orders Explained
3K views
·
Dec 16, 2022
102
16:17
Fastest Way to Trade Futures on ThinkorSwim
19K views
·
Dec 16, 2022
103
18:49
Trading Futures Options on ThinkorSwim
4K views
·
Dec 16, 2022
104
6:56
21 FREE Fundamentals You Need For ThinkorSwim | Custom Thinkscript for ThinkorSwim
6K views
·
Dec 16, 2022
105
12:25
Buy and Sell Options Using Stock Price on ThinkorSwim Mobile App
11 views
·
Dec 16, 2022
106
16:48
ThinkorSwim Web Options Trading Tutorial
5K views
·
Dec 16, 2022
107
11:46
Buy & Sell Alert Using RSI Cross Over on ThinkorSwim
9K views
·
Sep 19, 2022
108
23:24
ThinkorSwim Web Options Spreads Tutorial | Verticals, Iron Condors, Butterfly
2K views
·
Jan 2, 2023
109
12:35
ThinkorSwim Web Advanced Order Types Explained
3K views
·
Jan 2, 2023