Top 8 Free Dataset Sources to Use for Data Science Projects
3K views · Jul 11, 2023 codingpakistan.com
Data is the foundation of data science, and there are a number of free datasets available online that can be used for data science projects. Here are some of the top 8 free dataset sources: Google Dataset Search Kaggle UCI Machine Learning Repository Data.gov World Bank Open Data OpenML GitHub Amazon Web Services (AWS) These sources offer a wide variety of datasets on a variety of topics, so you're sure to find the perfect dataset for your next data science project.
5 Mind-Blowing Ways Facebook Uses Machine Learning
963 views · Jul 11, 2023 codingpakistan.com
Machine learning is a powerful tool that Facebook uses to power many of its features. Here are 5 mind-blowing ways Facebook uses machine learning: Facial recognition: Facebook uses machine learning to recognize faces in photos and videos. This is used to suggest friends, tag people in photos, and even unlock your phone with your face. Textual analysis: Facebook uses machine learning to analyze text in posts, comments, and messages. This is used to understand the context of conversations, detect spam and abuse, and even suggest relevant content. Image recognition: Facebook uses machine learning to identify objects in images. This is used to tag products in photos, suggest relevant ads, and even create augmented reality experiences. Natural language processing: Facebook uses machine learning to understand human language. This is used to translate languages, answer questions, and even generate creative text formats. Recommendation engines: Facebook uses machine learning to recommend friends, content, and products to users. This is based on a variety of factors, such as what users have liked in the past, what their friends have liked, and what is popular on the platform. These are just a few of the many ways Facebook uses machine learning. As the technology continues to develop, we can expect to see even more innovative and groundbreaking applications emerge.
Why companies like Amazon, Microsoft, Google focuses on Data...
123 views · Jul 11, 2023 codingpakistan.com
Data structures and algorithms are the foundation of computer science. They are the building blocks that are used to create efficient and scalable software systems. Companies like Amazon, Microsoft, and Google rely on these technologies to power their businesses. Here are some of the reasons why these companies focus on data structures and algorithms: Efficiency: Data structures and algorithms can be used to design efficient algorithms that can solve problems quickly and efficiently. This is essential for large-scale systems that need to process large amounts of data. Scalability: Data structures and algorithms can be used to design scalable systems that can handle increasing amounts of traffic and data. This is essential for companies that are growing rapidly and need to be able to handle their growing user base. Reliability: Data structures and algorithms can be used to design reliable systems that are resistant to errors. This is essential for companies that need to ensure that their systems are always available and that their data is always secure. In addition to these technical reasons, companies like Amazon, Microsoft, and Google also focus on data structures and algorithms because they are a good way to assess the problem-solving skills of potential employees. These companies are looking for engineers who can design and implement efficient and scalable solutions to complex problems. If you are interested in working for a company like Amazon, Microsoft, or Google, then you should make sure that you have a strong understanding of data structures and algorithms. These skills will give you a foundation that will allow you to succeed in these competitive industries.
How to Get an Internship in Data Science?
1K views · Jul 11, 2023 codingpakistan.com
Data science is a rapidly growing field with high demand for professionals. If you are interested in a career in data science, an internship is a great way to get your foot in the door. Here are some tips on how to get an internship in data science: Start early: The best time to start looking for an internship is in the fall of the year before you want to start your internship. This will give you plenty of time to apply for internships and to prepare for interviews. Network: One of the best ways to find an internship is to network with people who work in data science. Attend industry events, connect with people on LinkedIn, and reach out to your friends and family who work in the field. Build your skills: In order to be competitive for data science internships, you need to have the necessary skills. This includes having a strong foundation in mathematics, statistics, and programming. You should also be familiar with the latest data science tools and techniques. Tailor your resume and cover letter: When you apply for data science internships, it is important to tailor your resume and cover letter to the specific internship you are applying for. This means highlighting the skills and experience that are most relevant to the internship. Prepare for interviews: Once you start getting interviews, it is important to be prepared. This means practicing your answers to common interview questions and being able to talk about your skills and experience.
7 Best Open Source Big Data Projects to Level Up Your Skills
478 views · Jul 13, 2023 codingpakistan.com
This video discusses 7 of the best open source big data projects that you can work on to level up your skills in big data. The projects include: Apache Hadoop Apache Spark Apache Cassandra MongoDB HPCC Apache Storm Apache SAMOA Atlas.ti The video also discusses the benefits of working on open source big data projects, such as gaining hands-on experience with big data technologies, contributing to the open source community, and building your portfolio. If you are interested in learning more about big data, or if you are looking for ways to level up your skills in big data, then this video is a great resource for you.
Top 8 Data Science Competitions To Consider in 2023
1K views · Jul 13, 2023 codingpakistan.com
Data science competitions are a great way to learn new skills, test your abilities, and network with other data scientists. There are many different competitions available, so you can find one that interests you and fits your skill level. Here are 8 of the top data science competitions to consider in 2023: Kaggle DrivenData Codalab Iron Viz Topcoder International Data Analysis Olympiad (IDAHO) CrowdANALYTIX Community Bitgrit These competitions cover a wide range of topics, from machine learning to natural language processing to data visualization. They are also open to a variety of skill levels, so you can find one that is challenging but achievable. If you are interested in participating in a data science competition, I recommend checking out the websites of the competitions I mentioned. They have all the information you need to get started, including the rules, the datasets, and the prizes.

How to Become a Data Scientist in 2023: A Complete Guide
546 views · Jul 13, 2023 codingpakistan.com
Data science is a rapidly growing field, and there is a high demand for skilled data scientists. If you are interested in becoming a data scientist, there are a few things you need to do. First, you need to have a strong foundation in mathematics, statistics, and computer science. You should also be familiar with programming languages such as Python and R. Second, you need to gain experience working with data. You can do this by taking online courses, participating in data science competitions, or working as a data analyst. Third, you need to build your network. Attend data science meetups and conferences, and connect with other data scientists on LinkedIn. Finally, you need to be patient and persistent. It takes time and effort to become a data scientist, but it is a rewarding career path.
Top 7 Data Analytics Trends for 2023
1K views · Jul 13, 2023 codingpakistan.com
Data analytics is a rapidly growing field, and there are a number of trends that are expected to shape the field in 2023. These trends include: The rise of artificial intelligence (AI) The growth of big data The increasing importance of real-time analytics The use of cloud computing The increasing focus on data security The democratization of data analytics The emergence of new data analytics tools and techniques These trends are expected to make data analytics more accessible, powerful, and valuable for businesses of all sizes. By understanding these trends, businesses can be prepared to take advantage of the opportunities that data analytics has to offer.
Why Data Visualization Matters in Data Analytics?
2K views · Jul 13, 2023 codingpakistan.com
Data visualization is the process of transforming data into a visual format that can be easily understood and interpreted. It is a powerful tool that can be used to communicate insights from data to stakeholders. In data analytics, data visualization is used to: Identify patterns and trends: Data visualization can help you to identify patterns and trends in your data that would be difficult to see otherwise. This information can be used to make better decisions about your business. Communicate insights: Data visualization can be used to communicate insights from data to stakeholders in a way that is easy to understand. This can help to build trust and credibility with your stakeholders. Enhance decision-making: Data visualization can help you to make better decisions by providing you with a clear and concise view of your data. This can help you to identify the most important factors to consider when making a decision.
How to Become a Data Analyst in 2023: A Complete Guide
1K views · Jul 13, 2023 codingpakistan.com
Data analysts are in high demand, and the field is only expected to grow in the coming years. If you are interested in becoming a data analyst, there are a few things you need to do. First, you need to have a strong foundation in mathematics, statistics, and computer science. You should also be familiar with programming languages such as Python and R. Second, you need to gain experience working with data. You can do this by taking online courses, participating in data science competitions, or working as a data analyst. Third, you need to build your network. Attend data science meetups and conferences, and connect with other data analysts on LinkedIn. Finally, you need to be patient and persistent. It takes time and effort to become a data analyst, but it is a rewarding career path.
Top Online Communities Every Data Scientist Must Know
362 views · Jul 13, 2023 codingpakistan.com
Data science is a rapidly growing field, and there are a number of online communities that can help data scientists stay up-to-date on the latest trends, learn new skills, and connect with other data scientists. In this video, we will discuss the top online communities for data scientists. We will look at the features of each community, the types of people who participate, and how to get involved. Some of the communities that we will discuss include: Reddit: Reddit is a popular social media platform with a number of subreddits dedicated to data science. These subreddits are a great place to ask questions, share insights, and learn from others. Kaggle: Kaggle is a website that hosts data science competitions and provides a platform for data scientists to share and discuss datasets. Stack Overflow: Stack Overflow is a question-and-answer website for programmers. There is a large and active community of data scientists on Stack Overflow, and it is a great place to find answers to your data science questions. Data Science Central: Data Science Central is a website that provides resources and support for data scientists. There are forums, articles, and tutorials on a variety of data science topics. Meetup: Meetup is a website that allows people to find and join local groups. There are a number of Meetup groups for data scientists, and they are a great way to connect with other data scientists in your area. These are just a few of the many online communities for data scientists. With so many communities to choose from, there is sure to be one that is perfect for you.
How to Get Masters in Data Science in 2023
485 views · Jul 13, 2023 codingpakistan.com
Data science is a rapidly growing field, and there is a high demand for data scientists. If you are interested in a career in data science, a master's degree is a great way to get started. In this video, we will discuss how to get a master's degree in data science in 2023. We will cover the following topics: Choosing a program: There are many different master's programs in data science available, so it is important to choose one that is right for you. Prerequisites: Most programs require applicants to have a bachelor's degree in a related field, such as computer science, mathematics, or statistics. Admissions requirements: In addition to prerequisites, programs may also require applicants to take the GRE or other standardized tests. Financial aid: There are many different financial aid options available for students pursuing a master's degree in data science. The job market: The job market for data scientists is very strong, and salaries are high. We will also provide some tips for applying to master's programs in data science and for succeeding in the program.
10 Types of Tableau Charts For Data Visualization
2K views · Jul 14, 2023 codingpakistan.com
Tableau is a powerful data visualization tool that can be used to create a variety of charts and graphs. Here are 10 of the most popular Tableau charts: Bar charts: Bar charts are a simple and effective way to visualize categorical data. They can be used to show comparisons between different groups or to track changes over time. Pie charts: Pie charts are a good way to show the relative size of different parts of a whole. However, they can be difficult to read if there are too many slices. Line charts: Line charts are a good way to show trends over time. They can also be used to show the relationship between two variables. Area charts: Area charts are similar to line charts, but they fill the area under the line. This can be helpful for showing changes in the overall size of something over time. Scatter plots: Scatter plots are a good way to show the relationship between two numeric variables. The points on the scatter plot are plotted according to their values for the two variables. Treemaps: Treemaps are a good way to visualize hierarchical data. They show the size of each node in the hierarchy as a rectangle. The size of the rectangle is proportional to the size of the node. Heatmaps: Heatmaps are a good way to visualize data that has been grouped into a grid. The cells in the grid are colored according to their values. Geo maps: Geo maps are a good way to visualize data that is associated with geographic locations. The map is divided into different regions, and the values for the data are displayed in each region. Dashboards: Dashboards are a collection of charts and other visualizations that are displayed together. Dashboards can be used to track progress, make decisions, or communicate information to others. These are just a few of the many types of Tableau charts that can be used for data visualization. The best type of chart for a particular data set will depend on the specific needs of the user.
How to Become a Research Analyst?
1K views · Jul 14, 2023 codingpakistan.com
Research analysts are responsible for gathering and analyzing data to help businesses make informed decisions. They work in a variety of industries, including finance, healthcare, and technology. To become a research analyst, you will need to have a strong foundation in math, statistics, and economics. You will also need to be able to think critically and solve problems. Here are the steps on how to become a research analyst: Earn a bachelor's degree in a relevant field. This could include a degree in economics, finance, business administration, or statistics. Gain experience. You can gain experience by working as an intern or by taking on research projects. Get certified. There are a number of certification programs available for research analysts. These programs can help you demonstrate your skills and knowledge to potential employers. Network. Attend industry events and connect with other research analysts. This will help you learn about job opportunities and build relationships.
4 Easy Steps to Create a Dashboard in Tableau
972 views · Jul 14, 2023 codingpakistan.com
Tableau is a powerful data visualization tool that can be used to create dashboards. Dashboards are a great way to communicate data insights to others. In this video, we will discuss 4 easy steps to create a dashboard in Tableau. Step 1: Connect to your data The first step is to connect to your data source. Tableau supports a wide variety of data sources, including Excel, CSV files, and databases. Step 2: Create your visualizations Once you have connected to your data, you can start creating your visualizations. Tableau offers a variety of visualization types, including bar charts, line charts, and pie charts. Step 3: Add filters and actions Filters and actions allow you to interact with your visualizations. Filters allow you to filter the data that is displayed in your visualizations. Actions allow you to drill down into the data or to see related data. Step 4: Publish your dashboard Once you have created your dashboard, you can publish it so that others can view it. Tableau offers a variety of ways to publish your dashboards, including publishing them to the web or to Tableau Server.
How to Find Your Data Science Mentor in 2023?
51 views · Jul 14, 2023 codingpakistan.com
A data science mentor can be a valuable asset in your career. They can help you learn the ropes, provide guidance, and connect you with opportunities. If you are looking for a data science mentor in 2023, here are a few tips: Start by networking. Talk to people in the data science community, both online and offline. Attend meetups, conferences, and workshops. You never know who you might meet who can help you find a mentor. Look for mentors online. There are a number of online platforms that connect mentors and mentees. Some popular options include Mentorship.io, LinkedIn, and AngelList. Reach out to people you admire. If there is a data scientist whose work you admire, reach out to them and ask if they would be willing to mentor you. You never know, they might say yes! Be prepared to put in the work. Finding a data science mentor is just the first step. Once you have found a mentor, you need to be prepared to put in the work. This means being open to feedback, being willing to learn, and being proactive. Finding a data science mentor can be a great way to accelerate your career. By following these tips, you can increase your chances of finding a mentor who can help you achieve your goals.
Top Kaggle Courses For Data Science
956 views · Jul 14, 2023 codingpakistan.com
Kaggle is a platform for data scientists and machine learning practitioners to compete and collaborate on data science projects. It offers a number of free and paid courses that can help you learn data science and machine learning. Some of the top Kaggle courses for data science include: Data Science for Beginners by Ameet Talwalkar Machine Learning for Data Science by Andrew Ng Deep Learning for Coders by fast.ai Practical Data Science with Python by IBM Advanced Machine Learning with TensorFlow by TensorFlow These courses cover a variety of topics, such as data wrangling, machine learning, and data visualization. They are a great way to learn data science and machine learning, regardless of your experience level.

Top Online Courses to Learn Data Science with Certifications
2K views · Jul 14, 2023 codingpakistan.com
Data science is a rapidly growing field that is in high demand. If you are interested in learning data science, there are a number of great online courses that can help you get started. Here are some of the top online courses to learn data science with certifications: Coursera edX Udacity Khan Academy Datacamp These courses offer a variety of topics, from the basics of data science to more advanced topics such as machine learning and artificial intelligence. They also offer certifications that can help you demonstrate your skills to potential employers. When choosing an online data science course, it is important to consider your learning style, the instructor, the reviews, and the cost.
What is Augmented Analytics in Data Science?
37 views · Jul 14, 2023 codingpakistan.com
Augmented analytics is a new approach to data science that combines the power of machine learning with human intuition. It uses interactive visualizations and natural language processing to help users explore data more easily and discover insights that would otherwise be difficult to find. Augmented analytics is still a relatively new field, but it has the potential to revolutionize the way we work with data. By making data more accessible and understandable, it can help businesses make better decisions, improve their operations, and create new products and services. Here are some of the benefits of augmented analytics: It can help users explore data more easily. Augmented analytics uses interactive visualizations and natural language processing to make data more accessible and understandable. This allows users to explore data more quickly and easily, and to discover insights that would otherwise be difficult to find. It can help users make better decisions. By providing users with insights into their data, augmented analytics can help them make better decisions. This is especially helpful for businesses that need to make quick decisions based on data. It can help businesses improve their operations. Augmented analytics can help businesses improve their operations by identifying areas where they can improve efficiency or reduce costs. This can lead to significant savings for businesses. It can help businesses create new products and services. Augmented analytics can help businesses create new products and services by providing insights into customer behavior and preferences. This can help businesses develop products and services that are more likely to be successful. If you are interested in learning more about augmented analytics, there are a number of resources available online. You can also find a number of augmented analytics tools on the market.
How is Data Science Changing the Healthcare Industry?
133 views · Jul 14, 2023 codingpakistan.com
Data science is rapidly changing the healthcare industry. It is being used to improve patient care, reduce costs, and make healthcare more efficient. Here are some of the ways that data science is changing healthcare: Personalized medicine: Data science is being used to develop personalized medicine, which is a type of care that is tailored to the individual patient's needs. This is done by using data to analyze the patient's genetic makeup, medical history, and lifestyle factors. Risk assessment: Data science is being used to assess the risk of patients developing certain diseases. This information can be used to help patients make informed decisions about their health and to develop preventive measures. Fraud detection: Data science is being used to detect fraud in healthcare. This is done by analyzing data to identify patterns that are indicative of fraud. Clinical decision support: Data science is being used to develop clinical decision support tools, which are software programs that help doctors make better decisions about patient care. These tools can analyze data to identify potential problems and to recommend treatment options. Healthcare analytics: Data science is being used to analyze healthcare data to identify trends and patterns. This information can be used to improve the efficiency of healthcare systems and to identify areas where improvements can be made. Data science is still a relatively new field, but it has the potential to revolutionize the healthcare industry. By making better use of data, data science can help to improve patient care, reduce costs, and make healthcare more efficient.
Top 10 Libraries for Data Visualization in 2023
723 views · Jul 15, 2023 codingpakistan.com
Data visualization is the process of transforming data into a visual format that makes it easier to understand and interpret. There are a number of libraries available that can be used to create data visualizations, each with its own strengths and weaknesses. Here are the top 10 libraries for data visualization in 2023: Matplotlib: Matplotlib is a Python library that is widely used for data visualization. It is free and open-source, and it has a large community of users and developers. Matplotlib can be used to create a wide variety of visualizations, including line charts, bar charts, scatter plots, and pie charts. Seaborn: Seaborn is a Python library that is built on top of Matplotlib. It provides a high-level interface for creating attractive and informative visualizations. Seaborn is particularly well-suited for creating statistical visualizations, such as heatmaps and correlation matrices. Plotly: Plotly is a Python library that can be used to create interactive visualizations. Plotly visualizations can be embedded in web pages or dashboards, and they can be shared with others. Plotly also provides a number of tools for analyzing and exploring data. Bokeh: Bokeh is a Python library that is similar to Plotly, but it is focused on creating web-based visualizations. Bokeh visualizations are interactive and can be used to explore data in real time. ggplot2: ggplot2 is a R library that is widely used for data visualization. It is based on the grammar of graphics, which is a systematic approach to creating visualizations. ggplot2 can be used to create a wide variety of visualizations, and it is particularly well-suited for creating publication-quality graphics. D3.js: D3.js is a JavaScript library that can be used to create interactive visualizations. D3.js is particularly well-suited for creating visualizations that are responsive to user interaction. Vega: Vega is a declarative language for creating visualizations. Vega visualizations are typically rendered in HTML, SVG, or Canvas. Vega-Lite: Vega-Lite is a lightweight version of Vega. It is designed to be easier to learn and use, and it is still capable of creating powerful visualizations. Dygraph: Dygraph is a JavaScript library that can be used to create interactive line charts. Dygraphs are particularly well-suited for creating visualizations of time series data. Highcharts: Highcharts is a JavaScript library that can be used to create interactive charts and graphs. Highcharts is particularly well-suited for creating visualizations of financial data. The best library for data visualization will depend on your specific needs and requirements. However, all of the libraries listed above offer a variety of features and capabilities that can be used to create high-quality visualizations.
Top Trends in the Data Center Industry
1K views · Jul 15, 2023 codingpakistan.com
The data center industry is constantly evolving, as new technologies and trends emerge. Here are some of the top trends in the data center industry: Edge computing: Edge computing brings computation and storage closer to the end user. This can improve performance and reduce latency. Artificial intelligence (AI): AI is being used in a variety of ways in data centers, such as for predictive analytics, anomaly detection, and workload optimization. Containerization: Containerization is a way of packaging and deploying applications. This can improve the efficiency and scalability of data centers. Hyperconvergence: Hyperconvergence combines compute, storage, and networking into a single system. This can simplify data center management and reduce costs. Software-defined everything (SDDC): SDDC is a set of technologies that allow data centers to be managed and operated as software. This can improve agility and scalability. Green data centers: Green data centers are designed to be energy-efficient. This is important as data centers consume a significant amount of energy. These are just a few of the top trends in the data center industry. As the industry continues to evolve, we can expect to see even more new and innovative technologies emerge.
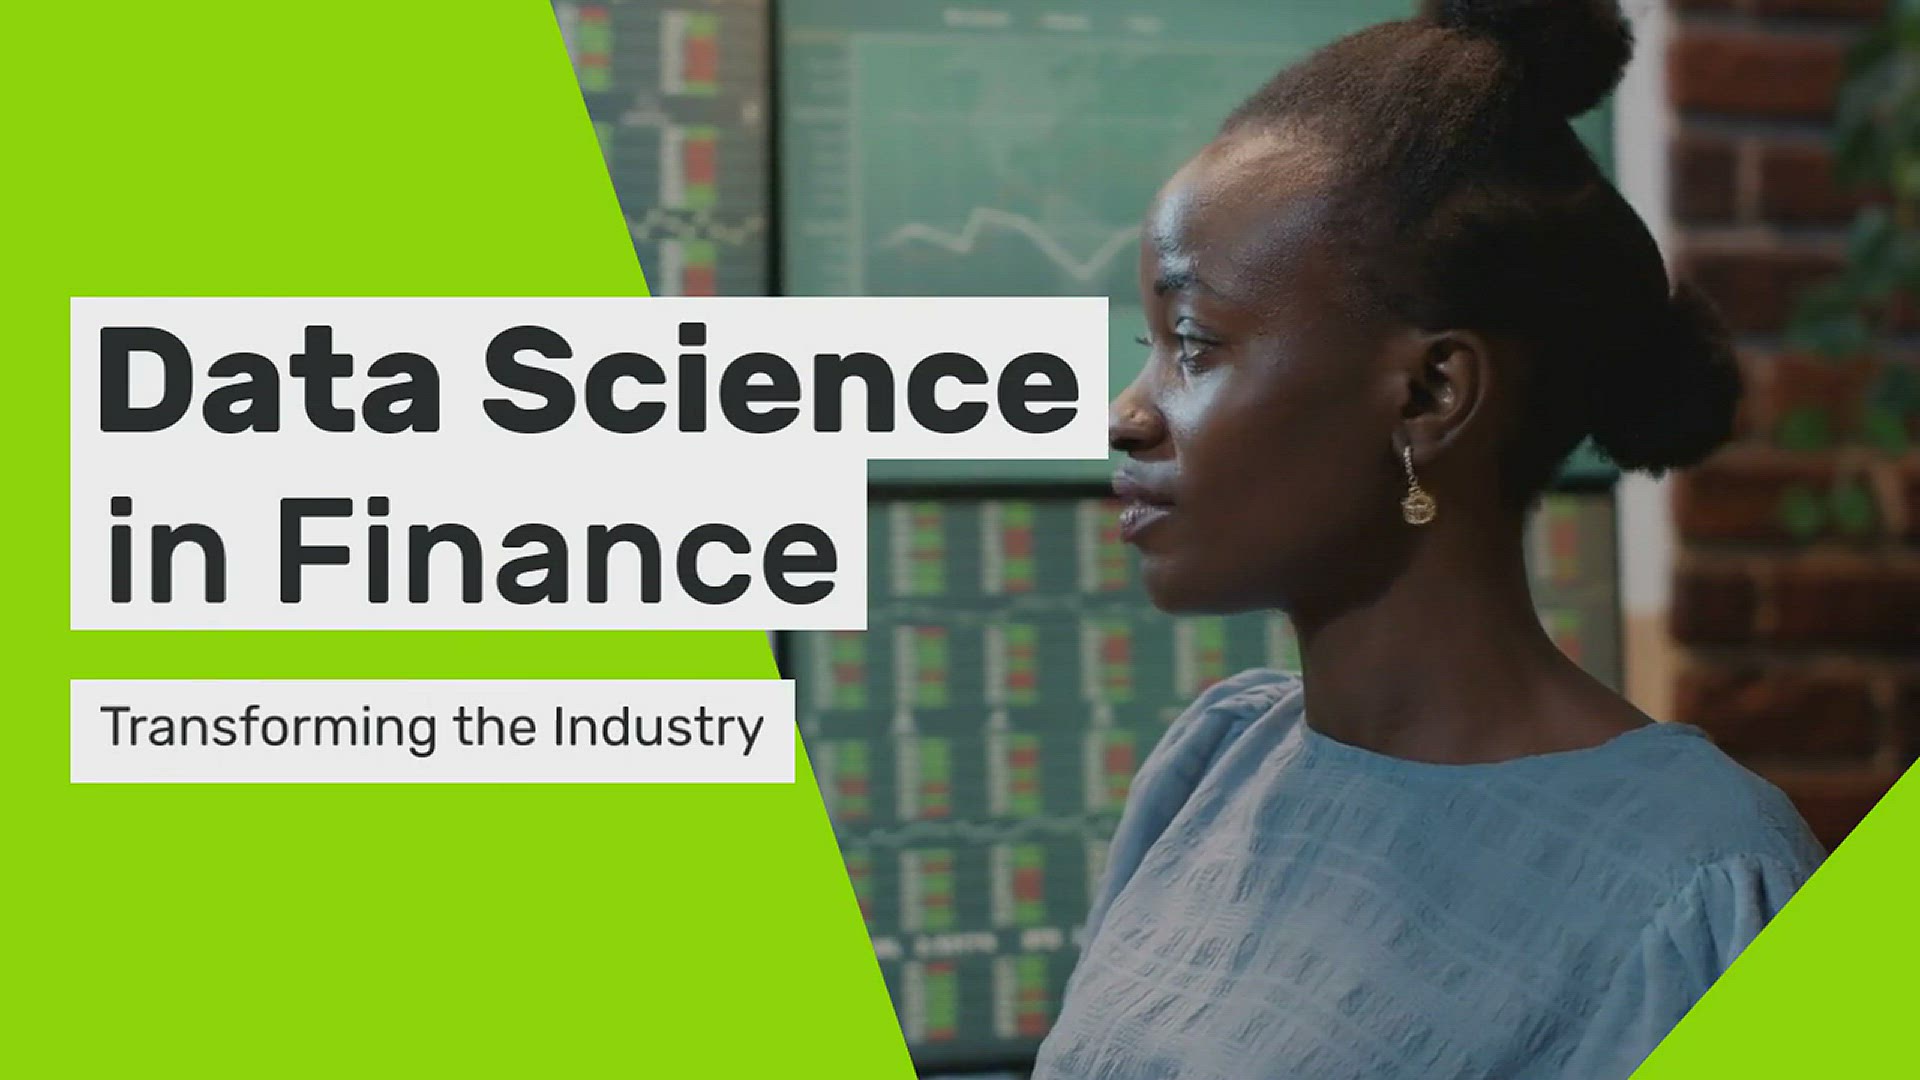
Top Data Science Use Cases in Finance Sector
2K views · Jul 15, 2023 codingpakistan.com
Data science is rapidly changing the way the finance industry operates. By analyzing large amounts of data, financial institutions can gain insights into customer behavior, identify trends, and improve their marketing and operations. In this video, we will discuss some of the top data science use cases in the finance sector. We will cover topics such as: Fraud detection: Data science can be used to identify fraudulent transactions. This can help financial institutions to protect themselves from financial losses. Risk management: Data science can be used to assess risk and make better investment decisions. This can help financial institutions to mitigate losses and improve their bottom line. Customer segmentation: Data science can be used to divide customers into groups based on their demographics, interests, and purchase behavior. This can help financial institutions to target their marketing campaigns more effectively. Portfolio optimization: Data science can be used to optimize investment portfolios. This can help financial institutions to maximize profits and reduce risk. Market forecasting: Data science can be used to forecast market trends. This can help financial institutions to make better investment decisions and mitigate risk. These are just a few of the many ways that data science is being used in the finance sector today. As data science continues to evolve, we can expect to see even more innovative applications in the future.
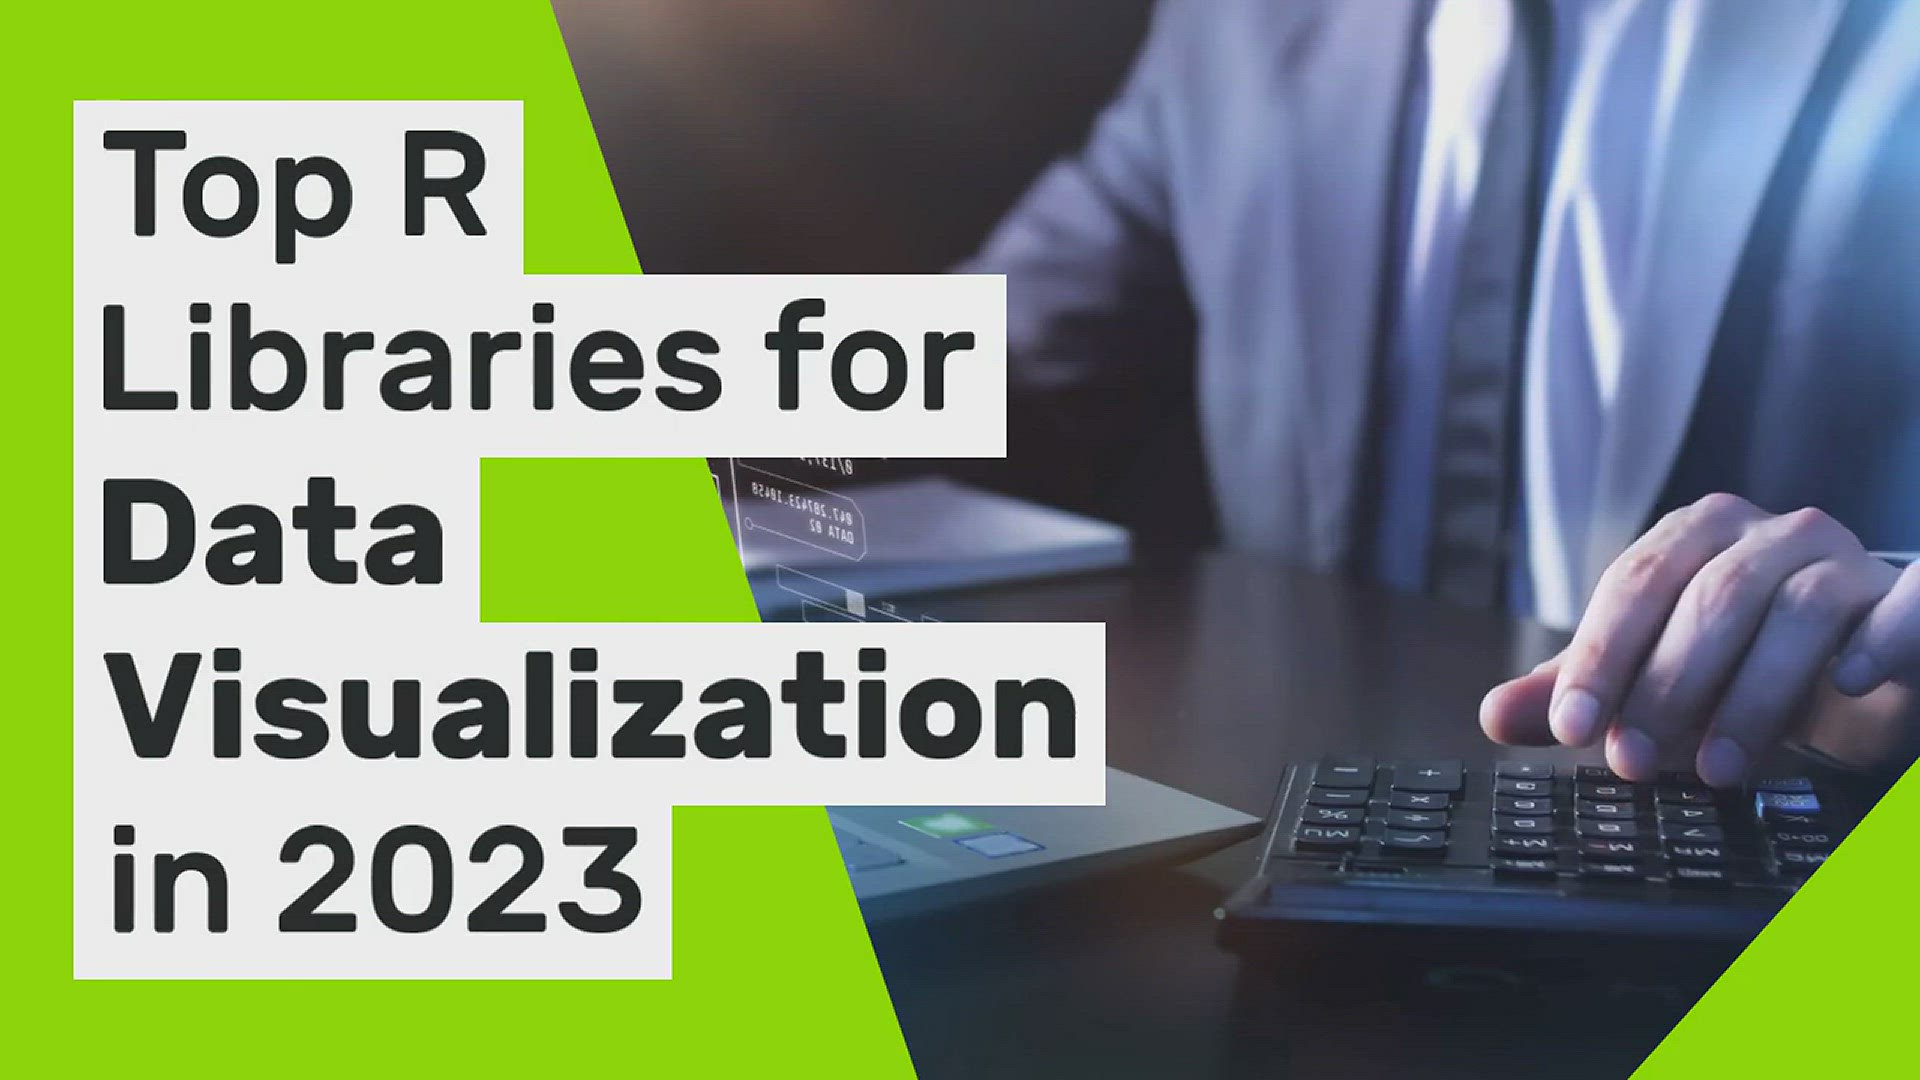
Top R Libraries for Data Visualization in 2023
856 views · Jul 15, 2023 codingpakistan.com
R is a popular programming language for data science, and it has a wide range of libraries for data visualization. In this video, we will discuss some of the top R libraries for data visualization in 2023. ggplot2 is one of the most popular R libraries for data visualization. It is based on the grammar of graphics, which is a set of rules for describing and building graphs. ggplot2 is very flexible and can be used to create a wide variety of visualizations. plotly is another popular R library for data visualization. It is a JavaScript library that can be used to create interactive visualizations. plotly is especially well-suited for creating dashboards and web-based visualizations. dygraphs is an R library for creating interactive time series visualizations. dygraphs is based on the JavaScript library dygraphs.js. leaflet is an R library for creating interactive maps. leaflet is based on the JavaScript library leaflet.js. esquisse is an R library for creating interactive data visualizations. esquisse is a newer library, but it is quickly gaining popularity due to its ease of use and flexibility. These are just a few of the many R libraries that can be used for data visualization. The best library for you will depend on your specific needs and preferences.
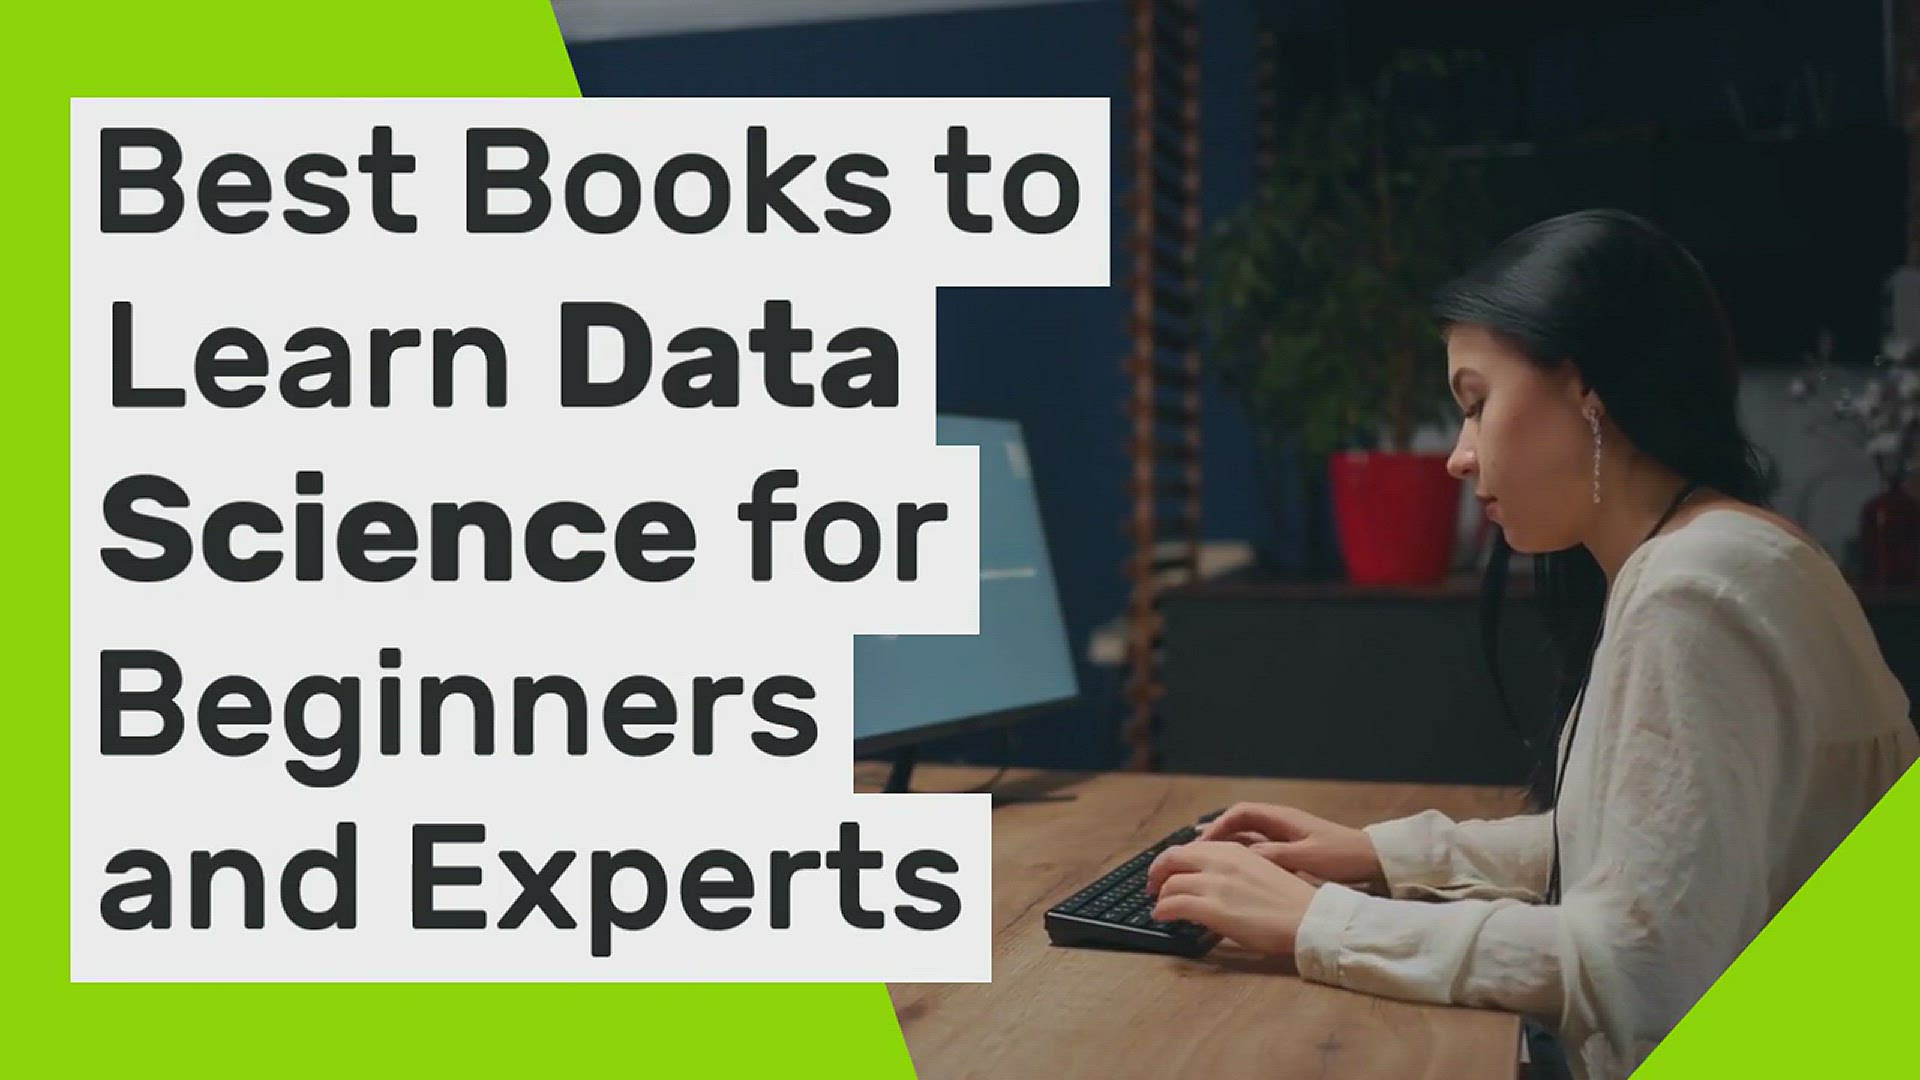
Best Books to Learn Data Science for Beginners and Experts
4K views · Jul 15, 2023 codingpakistan.com
Data science is a rapidly growing field, and there are many great books available to help you learn the basics and beyond. In this video, we will discuss some of the best books to learn data science for beginners and experts. For beginners: Python for Data Analysis by Wes McKinney is a great introduction to data science using Python. It covers the basics of Python programming, as well as data analysis techniques such as data wrangling, cleaning, and visualization. Hands-On Machine Learning with Scikit-Learn and TensorFlow by Aurélien Géron is a great introduction to machine learning using Python. It covers a wide range of machine learning algorithms, including supervised learning, unsupervised learning, and reinforcement learning. Introduction to Statistical Learning by Gareth James, Daniela Witten, Trevor Hastie, and Robert Tibshirani is a classic introduction to statistical learning. It covers a wide range of statistical concepts, as well as machine learning algorithms. For experts: The Elements of Statistical Learning by Trevor Hastie, Robert Tibshirani, and Jerome Friedman is a more advanced book on statistical learning. It covers a more in-depth treatment of statistical concepts, as well as machine learning algorithms. Machine Learning: A Probabilistic Perspective by Kevin P. Murphy is a comprehensive book on machine learning from a probabilistic perspective. It covers a wide range of machine learning algorithms, as well as the underlying statistical principles. Deep Learning by Ian Goodfellow, Yoshua Bengio, and Aaron Courville is a comprehensive book on deep learning. It covers the basics of deep learning, as well as advanced topics such as convolutional neural networks and recurrent neural networks. These are just a few of the many great books available to learn data science. The best book for you will depend on your specific needs and experience level.

Top Programming Languages for Data Science in 2023
3K views · Jul 15, 2023 codingpakistan.com
Data science is a rapidly growing field, and there are many programming languages that can be used for data science tasks. In this video, we will discuss some of the top programming languages for data science in 2023. Python programming languageOpens in a new window www.aezion.com Python programming language Python: Python is one of the most popular programming languages for data science. It is easy to learn and use, and there are many libraries and tools available for data science tasks. R: R is another popular programming language for data science. It is especially well-suited for statistical analysis, and there are many R libraries available for data visualization. SQL: SQL is a database language that is used to query and manipulate data. It is essential for data science tasks that involve working with databases. Java: Java is a general-purpose programming language that is also used for data science tasks. It is especially well-suited for large-scale data processing. Scala: Scala is a newer programming language that is designed for both functional and object-oriented programming. It is gaining popularity for data science tasks due to its performance and scalability. Julia: Julia is a newer programming language that is designed for high-performance computing. It is gaining popularity for data science tasks due to its speed and flexibility. These are just a few of the many programming languages that can be used for data science. The best language for you will depend on your specific needs and preferences.
What is Data as a Service (DaaS) in the Tech Industry?
1K views · Jul 15, 2023 codingpakistan.com
usinesses, including: Reduced IT costs: DaaS eliminates the need to purchase and maintain on-premises data storage and processing infrastructure. Increased agility: DaaS allows businesses to scale their data capabilities up or down as needed, without having to make major investments in hardware or software. Improved security: DaaS providers typically have robust security measures in place to protect customer data. There are a number of different DaaS models available, including: Data storage: This model provides businesses with access to a cloud-based data storage repository. Data processing: This model provides businesses with access to cloud-based data processing services, such as data mining and analytics. Data analytics: This model provides businesses with access to cloud-based data analytics tools and applications. DaaS is a growing trend in the tech industry, and it is being used by businesses of all sizes to improve their data management capabilities. Some of the industries that are using DaaS include:
What is Tableau and its Importance in Data Visualization?
820 views · Jul 15, 2023 codingpakistan.com
Tableau is a data visualization software that allows users to create interactive dashboards and visualizations from data. It is a powerful tool that can be used to explore data, identify trends, and communicate insights to others. Tableau is important in data visualization because it makes it easy to create visually appealing and informative visualizations. It also provides a number of features that make it easy to explore and analyze data, such as filters, sorting, and drilling down. In this video, we will discuss the following topics: What is Tableau? How does Tableau work? What are the benefits of using Tableau? What are the different types of visualizations that can be created with Tableau? How to use Tableau to explore and analyze data How to create interactive dashboards with Tableau We will also discuss the importance of data visualization in business and how Tableau can be used to improve decision-making.
Top 10 R Libraries for Data Science in 2023
2K views · Jul 15, 2023 codingpakistan.com
R is a powerful programming language for data science, and there are a number of great libraries that can be used to extend its functionality. In this video, we will discuss the top 10 R libraries for data science in 2023. dplyr R libraryOpens in a new window robotwealth.com dplyr R library 1. dplyr is a library for data manipulation. It provides a number of functions for selecting, filtering, and transforming data frames. 2. ggplot2 is a library for data visualization. It provides a powerful and flexible framework for creating charts, graphs, and maps. 3. tidyverse is a collection of R packages that work together to make data science easier. It includes dplyr, ggplot2, and a number of other popular libraries. 4. caret is a library for machine learning. It provides a number of functions for training and evaluating machine learning models. 5. randomForest is a library for random forest machine learning. It provides a number of functions for training and evaluating random forest models. 6. xgboost is a library for extreme gradient boosting machine learning. It provides a number of functions for training and evaluating extreme gradient boosting models. 7. NLP is a library for natural language processing. It provides a number of functions for processing and analyzing text data. 8. Rcpp is a library for integrating R with C++. It allows R users to write code in C++ that can be called from R. 9. shiny is a library for creating interactive web applications. It allows R users to create web applications that can be used to explore and visualize data. 10. plotly is a library for creating interactive visualizations. It allows R users to create visualizations that can be embedded in web pages or shared on social media. These are just a few of the many great R libraries that are available for data science. The best library for you will depend on your specific needs.
How to Become a Chartered Data Scientist?
173 views · Jul 15, 2023 codingpakistan.com
The Chartered Data Scientist (CDS) designation is a professional certification that is awarded by the Association of Data Scientists (ADaSci). The CDS designation is designed to recognize data scientists who have demonstrated a high level of knowledge and skills in the field of data science. To become a Chartered Data Scientist, you must meet the following requirements: Have a bachelor's degree in a quantitative discipline, such as mathematics, statistics, computer science, or engineering. Have at least two years of full-time work experience in data science. Pass the CDS exam. The CDS exam is a rigorous exam that tests your knowledge of the following topics: Data science fundamentals Data mining Machine learning Natural language processing Data visualization Ethics in data science If you are interested in becoming a Chartered Data Scientist, I recommend that you start by taking the following steps: Learn about the CDS designation and the requirements for becoming a Chartered Data Scientist. Take some online courses or tutorials on data science. Get some work experience in data science. Prepare for the CDS exam.
Top Data Science Trends You Must Know in 2023
125 views · Jul 16, 2023 codingpakistan.com
Data science is a rapidly growing field, and the trends that will shape it in 2023 are already starting to emerge. Here are some of the top data science trends to watch in the coming year: The rise of large language models (LLMs): LLMs are AI systems that are trained on massive datasets of text and code. These models can generate text, translate languages, write different kinds of creative content, and answer your questions in an informative way. In 2023, we can expect to see LLMs being used in a wider variety of applications, such as customer service, education, and healthcare. The development of AI for social good: AI has the potential to be used for good, and in 2023, we can expect to see more AI projects being developed with the goal of solving social problems. For example, AI is being used to develop new medical treatments, to improve education, and to combat climate change. The increasing use of AI in the workplace: AI is already being used in many workplaces, and in 2023, we can expect to see even more AI-powered tools and applications being used by businesses. For example, AI is being used to automate tasks, to improve decision-making, and to personalize customer experiences. The growing concern about AI safety: As AI becomes more powerful, there is a growing concern about the potential for AI to be used for harmful purposes. In 2023, we can expect to see more research being done on AI safety, and we can expect to see the development of new regulations and guidelines for the development and use of AI. The emergence of new AI applications: As AI continues to develop, we can expect to see the emergence of new and innovative AI applications. For example, AI is being used to develop new forms of entertainment, to create new art forms, and to explore new scientific possibilities. These are just a few of the top data science trends to watch in 2023. As the field of data science continues to evolve, we can expect to see even more exciting and innovative developments in the years to come.
How are Companies Making Money From Big Data?
147 views · Jul 16, 2023 codingpakistan.com
Big data is a term used to describe the large and complex datasets that are collected by businesses and organizations. These datasets can be used to gain insights into customer behavior, identify trends, and make better decisions. There are a number of ways that companies are making money from big data. Some of the most common methods include: Targeted advertising: Companies can use big data to target their advertising to specific groups of people. This can be done by using data on past purchases, browsing history, and social media activity to create a profile of each user. Product recommendations: Companies can use big data to recommend products to users based on their past purchases, browsing history, and social media activity. This can help to increase sales and improve the customer experience. Fraud detection: Companies can use big data to detect fraudulent activity, such as credit card fraud and identity theft. This can help to protect customers and reduce financial losses. Risk assessment: Companies can use big data to assess the risk of certain events, such as customer churn or loan defaults. This can help to make better decisions about pricing, marketing, and lending. The ways that companies are making money from big data are constantly evolving. As big data becomes more sophisticated, companies will find new and innovative ways to use it to generate revenue.
The Worth of Dark Data in the Big Data World
508 views · Jul 16, 2023 codingpakistan.com
Dark data is a term used to describe data that is not being used or analyzed. It can be found in a variety of sources, including databases, file systems, and application logs. Dark data is often overlooked because it is difficult to access and analyze. However, it can be a valuable resource for businesses that are looking to gain insights into their customers, operations, and markets. In the big data world, dark data is often seen as a "hidden treasure trove" of information that can be used to gain a competitive advantage. However, unlocking the value of dark data requires a significant investment in time and resources. There are a number of challenges associated with extracting value from dark data. These challenges include: Data volume: Dark data can be very large in volume, making it difficult to store and process. Data quality: Dark data can be of poor quality, making it difficult to analyze. Data privacy: Dark data may contain sensitive information, which must be handled with care.
What is the Importance of Mathematics in Computer Science?
823 views · Jul 17, 2023 codingpakistan.com
Mathematics is essential to computer science. It is used in almost every aspect of computer science, from algorithms to data structures to artificial intelligence. Here are some of the reasons why mathematics is important in computer science: Algorithms: Algorithms are the heart of computer science. They are the step-by-step instructions that computers follow to solve problems. Many algorithms are based on mathematical principles, such as probability and statistics. Data structures: Data structures are the way that data is organized in a computer. They are used to store and retrieve data efficiently. Many data structures are based on mathematical principles, such as trees and graphs. Artificial intelligence: Artificial intelligence is a field of computer science that deals with the creation of intelligent agents. Intelligent agents are systems that can reason, learn, and act autonomously. Many of the techniques used in artificial intelligence are based on mathematics, such as probability and statistics. Cryptography: Cryptography is the study of secure communication. It is used to protect information from unauthorized access. Many cryptographic techniques are based on mathematics, such as number theory and modular arithmetic.
Top 7 Databases to Learn in 2023
2K views · Jul 19, 2023 codingpakistan.com
MySQL is a popular relational database management system (RDBMS). It is open-source and free to use. MySQL is a good choice for small to medium-sized applications. PostgreSQL is another popular RDBMS. It is also open-source and free to use. PostgreSQL is known for its reliability and scalability. It is a good choice for large and complex applications. MongoDB is a NoSQL database. NoSQL databases are not based on the relational model. MongoDB is a good choice for storing large amounts of unstructured data. Redis is a key-value store. Key-value stores are a type of NoSQL database. Redis is a good choice for storing frequently accessed data. Cassandra is a distributed database. Distributed databases are designed to be scalable and fault-tolerant. Cassandra is a good choice for large-scale applications. HBase is a columnar database. Columnar databases are designed for storing large amounts of data. HBase is a good choice for big data applications. Elasticsearch is a search engine database. Search engine databases are designed for storing and searching large amounts of data. Elasticsearch is a good choice for applications that need to search and analyze data. These are just a few of the many databases that are available. The best database for you will depend on your specific needs.